Understanding the HAI Data
Understanding the Relationship between HAI Rate and SIR
In the past, HAI data were presented using infection rates. The rate was calculated simply as the number of HAIs divided by the appropriate denominator (e.g. for CLABSIs, this was central line days and for SSIs this was the total number of surgical procedures performed). However, these rates did not take into consideration the differences between health care settings and therefore made it difficult to truly compare each facility’s HAI experience to another.
A standardized infection ratio (SIR) can be used as a standardization method for summarizing HAI experience across any number of health care facility or unit types. It can track HAIs at a national, state, or local level over time and adjusts for patients of varying risk within each facility. Because of this, the SIR has become the new standard for comparing HAI incidence. Simply put, the SIR compares the facility’s actual HAI incidence to the baseline national HAI experience and adjusted for several risk factors that are significantly associated with differences in infection incidence.
To illustrate the way the SIR is calculated and to show how it can be used as an HAI comparison metric, the following example data are displayed below:
| Observed CLABSI Rates | National CLABSI Rates for 2008 | |||||
|---|---|---|---|---|---|---|
| Location Type | #CLABSI | #Central line-days | CLABSI rate* | #CLABSI | #Central line-days | CLABSI rate* |
| ICU | 170 | 100,000 | 1.7 | 1,200 | 600,000 | 2.0 |
| WARD | 58 | 58,000 | 1.0 | 600 | 400,000 | 1.5 |
*defined as the number of CLABSIs per 1000 central line-days
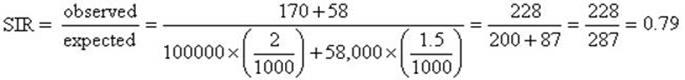
The SIR calculation is based on dividing the total number of observed CLABSI events by an “expected” or “predicted” number using the national CLABSI rates. This “expected” number is calculated by multiplying the national CLABSI rate by the observed number of central line-days for the specific location.
If the SIR is larger than 1, it means the health care facility reported more HAIs (proportionally) than the nation and therefore is doing worse than the national experience. If the SIR is less than 1, it means the health care facility reported fewer HAIs (proportionally) than the nation and therefore is doing better than the national experience. If the SIR is equal to 1, then the facility reported about the same number of HAIs as the national experience. For the example shown above, a SIR of 0.79 means that the facility had 21% less CLABSIs than what was expected, nationally.
An SSI (surgical site infection) SIR can also be calculated using the same calculation process as for CLABSI data.
For more a more Technical explanation of the SIR calculation, please see the National Healthcare Safety Network (NHSN) October 2010 newsletter at
NHSN SIR Guide https://www.cdc.gov/nhsn/pdfs/ps-analysis-resources/nhsn-sir-guide.pdfNHSN SIR Guide https://www.cdc.gov/nhsn/2022rebaseline/sir-guide.pdf
Back to top
